Dock Scheduling KPIs: Dock Utilization, Dwell Time, On-Time Arrival and No-Show Rate (With Formulas)
Four numbers tell you whether your docks are running well. Here is how to calculate each one from timestamps you already have, what the published benchmarks actually say, and what to do when a number is bad.

The four dock scheduling KPIs worth tracking are dock utilization rate, truck dwell time, on-time arrival rate and no-show rate. All four come from the same raw data: a booked slot and three timestamps per truck (arrived, docked in, departed). Dock utilization tells you whether your doors are busy, dwell time tells you how long trucks are on site, on-time arrival tells you whether carriers keep their appointments, and no-show rate tells you how much of your plan evaporates.
One thing to know before you start comparing yourself to the internet: no industry body publishes a target for dock utilization or no-show rate. The "75–85%" and "under 5%" figures that circulate online are not traced to any survey. We say so plainly below and give you the two sets of numbers that do have a real source behind them.
Why measure dock scheduling at all?
Because waiting at the dock is the single most expensive thing that happens to a truck, and it is invisible until you measure it.
The American Transportation Research Institute's 2024 study found that drivers were detained (held more than two hours) at 39.3% of all stops in 2023, and that detention cost the U.S. trucking industry $3.6 billion in direct expenses and $11.5 billion in lost productivity that year.[1] The U.S. Department of Transportation's Inspector General estimated that a 15-minute increase in average dwell time raises the expected truck crash rate by 6.2%.[2]
Those are industry totals. At your warehouse, the same problem shows up as detention invoices you cannot dispute, carriers who quietly raise their rates, and a receiving team that is either idle or swamped. You cannot fix slot lengths, negotiate free-time clauses or hold a carrier to account without numbers. The four KPIs below are the numbers.
What are the four dock scheduling KPIs?
Each KPI answers one operational question. The table shows the formula, the data you need and whether a published benchmark exists.
| KPI | Question it answers | Formula | Data needed | Published benchmark |
|---|---|---|---|---|
| Dock utilization rate | Are my doors busy? | Occupied door-hours ÷ (doors × operating hours) × 100 | Dock-in and dock-out time per truck; door count; opening hours | None. Online targets are unsourced. |
| Truck dwell time | How long are trucks on site? | Departure time − arrival time (per truck, then average or median) | Arrival and departure time per truck | Detention (dwell over 2 h) at 39.3% of stops (ATRI, 2024)[1]; FMCSA found about 1 in 10 stops detained, averaging 1.4 h beyond the 2-hour standard (2014)[3] |
| On-time arrival rate | Do carriers keep appointments? | Trucks arriving inside the window ÷ trucks that arrived × 100 | Arrival time and booked slot per truck; your window definition | No standard window. A 2019 McKinsey/TPA survey of 24 retailers and CPG manufacturers found no consensus on what counts as on time[5] |
| No-show rate | How much of my plan evaporates? | Appointments with no arrival ÷ appointments booked × 100 | Booking list; arrival status per booking | None published. |
The rest of this article takes each KPI in turn, then runs all four on one day of data from a six-door warehouse.
What is dock utilization rate and how do you calculate it?
Dock utilization rate is the share of available dock-door time that is actually spent loading or unloading. The formula is:
Dock utilization rate = occupied door-hours ÷ (number of doors × operating hours) × 100
"Occupied" means a truck is at the door and work is happening. Time a door spends waiting for a truck that has arrived but not yet been called forward does not count. Neither does a truck sitting at the door after loading is finished because paperwork is slow.
A worked example: a warehouse has 6 doors open from 06:00 to 18:00, which gives 6 × 12 = 72 door-hours of capacity. Over the day, trucks occupied the doors for a combined 51.8 hours. Utilization is 51.8 ÷ 72 = 72%.
There are two other versions of the metric you will meet, and it helps to know which one someone is quoting:
- Door snapshot. Doors in use ÷ total doors at a given moment. "Four of six doors busy" is 67%. Useful on a wall screen, useless for a monthly report.
- Booked slot utilization. Booked slot-hours ÷ available slot-hours. This is what a scheduling calendar shows before the day happens. It measures your plan, not your reality. If booked utilization is 80% and actual is 65%, the gap is no-shows, short loads and early departures. If actual is higher than booked, trucks are overrunning their slots.
Track actual utilization for decisions and booked utilization for forecasting. Reporting one as the other is the most common mistake we see.
What is a good dock utilization rate?
There is no published industry benchmark for dock utilization, so treat any specific target you read online as a rule of thumb at best.
The Warehousing Education and Research Council's annual DC Measures report, which is the closest thing the industry has to a benchmarking standard, headlines on-time shipments, warehouse capacity used and dock-to-stock time; dock-door utilization is not among its headline metrics.[4] The 75–85% figures that appear on glossary pages are not attributed to any survey.
What you can say with confidence comes from queueing logic rather than statistics: a dock that runs near 100% utilization has no slack, so any late truck, long load or short-staffed hour turns into a queue. Most operators therefore plan for headroom at peak hours and accept lower utilization early and late in the day. The useful comparison is not against a national number. It is your Door 3 against your Door 1, your 10:00 hour against your 15:00 hour, and this month against last month.
What to do when dock utilization is low or high
Low utilization (doors idle while trucks queue outside) usually means slots are longer than the loads actually take, or docking and paperwork are slow. Shorten slot lengths for load types that consistently finish early, and look at the gap between "arrived" and "docked in".
Very high utilization (no gaps, constant queues, overtime) means you are booking more than you can serve in the peak hours. Spread bookings by opening earlier slots, capping bookings per hour, or giving your biggest carriers fixed recurring windows. If two trucks are booked into one door at the same time, that is not high utilization, it is a conflict. See how to stop double-booking warehouse docks.
What is truck dwell time and how do you measure it?
Truck dwell time is the total time a truck spends at your site, from arrival at the gate to departure. The formula per truck is simple:
Dwell time = departure time − arrival time
Report it as an average and a median per week, and keep the per-truck list, because the outliers are where the money is.
Dwell time is more useful when you split it into three segments, because each has a different cause and a different fix:
| Segment | From → to | Typical cause when it is long |
|---|---|---|
| Wait time | Arrived → docked in | Early arrivals, doors still occupied, no one notified |
| Service time | Docked in → loading done | Slot too short, missing labour, wrong equipment |
| Exit time | Loading done → departed | Paperwork, signatures, gate process |
What is the difference between dwell time and detention?
Dwell time is the total time on site. Detention is the part of that time the carrier can bill you for, which is dwell time beyond the agreed free time, usually two hours:
Detention hours = max(0, dwell time − free time)
A truck that is on site for 2 hours 45 minutes against a 2-hour free-time clause has 45 minutes of billable detention. A truck on site for 1 hour 50 minutes has none, even though it is still a long visit. Dwell time is the number to watch internally, because by the time detention appears on an invoice it is too late to do anything about it. We cover the billing side in what is truck detention.
What do the published dwell-time numbers say?
Two U.S. studies are the only broad measurements with a traceable method:
- The Federal Motor Carrier Safety Administration's 2014 study found drivers experienced detention on roughly 1 in 10 stops, with an average of 1.4 hours beyond the 2-hour standard, meaning about 3.4 hours on site when detention happened.[3]
- ATRI's 2024 study, based on driver and carrier surveys for 2023, found detention at 39.3% of stops, with more than 135 million hours lost in for-hire trucking that year.[1] ATRI also found detained trucks drove 14.6% faster on average than trucks that were not detained, which suggests one way detention can turn into crash risk.[1][2]
The two studies used different methods and samples, so the gap between 10% and 39% is not a trend line. The honest takeaway is narrower: detention is common, and two hours is the free-time threshold everyone measures against.
What to do when dwell time is high
Find which segment is long. If wait time dominates, the problem is arrivals bunching up and doors not being ready; fix it with enforced appointment windows and a lead-time rule so last-minute bookings do not land in your busiest hour. If service time dominates, match slot lengths to real loading times per load type. If exit time dominates, look at your paperwork. The step-by-step version is in how to reduce truck detention fees.
What is on-time arrival rate and what counts as on time?
On-time arrival rate is the share of trucks that arrive inside their booked window. The formula is:
On-time arrival rate = trucks arriving within the window ÷ trucks that arrived × 100
Note the denominator: trucks that arrived, not trucks that were booked. No-shows get their own metric below. Mixing them hides both problems.
The hard part is defining "within the window", and there is no industry standard. When McKinsey and the Trading Partner Alliance surveyed 24 large North American retailers and consumer-goods manufacturers in 2019, they found no consensus on the time window within which a delivery counts as on time.[5] Retail compliance programmes mostly work in days; a dock schedule works in minutes.
For a dock calendar with 30-minute or 60-minute slots, a practical definition is: on time means arrival between 30 minutes before and 30 minutes after the slot start. Write the definition down, apply it to every carrier, and do not change it mid-quarter or your trend disappears.
Should early arrivals count as on time?
No. Count early and late separately, because they cause different problems. A truck that is 90 minutes early either occupies a door someone else booked or waits in your yard and starts its free-time clock before you are ready for it. McKinsey reported that about 25% of deliveries in the consumer sector arrive more than two hours before their scheduled appointment, while only 4% of shipments to retailers arrive more than 12 hours late.[5]
Report three numbers: on time, early, late. A carrier with 95% on time and 5% late needs a different conversation from one with 70% on time and 30% early.
How does on-time arrival relate to OTIF?
On-time arrival measures the truck reaching your dock inside its window. OTIF measures the order reaching the customer complete and on the agreed date. On-time arrival at the dock is the earliest point where an OTIF miss becomes visible: a truck that arrives late or early for collection ships late. If you supply retailers who score you on OTIF, this KPI is your leading indicator. See OTIF: what on time in full means and how to measure it.
What to do when on-time arrival is low
Sort the per-carrier numbers. On-time problems are almost always concentrated in a few carriers or a few routes. Share the figures with those carriers before you penalise anyone; most do not know. Then tighten the rules at the point of booking: a lead-time requirement stops bookings being made so late that the driver was never going to make them, and a booking portal that only shows genuinely free slots stops carriers picking windows that were already full. If a carrier stays below your threshold after that, you have the data to move the conversation to contract terms.
What is no-show rate and how do you handle no-shows?
No-show rate is the share of booked appointments where the truck never arrived. The formula is:
No-show rate = appointments with no arrival ÷ appointments booked × 100
Decide in advance what counts. A booking cancelled an hour before the slot is operationally a no-show: the door sat empty and nobody else could book it. A booking cancelled two days ahead is not. Set a cancellation cut-off (24 hours is common) and count anything cancelled after it as a no-show. Track reschedules as a separate number, since a carrier who moves every appointment twice is a planning problem even if the truck eventually arrives.
What is a good no-show rate?
There is no published benchmark for dock appointment no-shows. Figures you see quoted online are either worked examples or vendor assertions without data. We do not publish one either, because we have not yet run the analysis across our customer base with a consistent definition. When we do, we will label it as our data.
What you can do is set your own baseline over the first month and work to bring it down. A no-show on a 60-minute slot is 60 minutes of a door you cannot sell twice.
What to do when no-show rate is high
Make cancelling easier than not showing up. Carriers who have to call or email to cancel often do not bother. A self-service portal where the carrier can cancel or move the booking in two clicks lowers the barrier, and the freed slot becomes visible to everyone else immediately. Our carrier booking portal lets carriers view and cancel their own bookings without an account.
Then look at the per-carrier numbers again. A single carrier accounting for most no-shows is a contract conversation. No-shows spread across everyone usually point to your own process: slots booked too far ahead, no confirmation reminder, or a portal link that is hard to find.
Worked example: one day at a six-door warehouse
Here is one day of data for a six-door warehouse open 06:00–18:00, with 60-minute slots and a 2-hour free-time clause. The numbers are illustrative, chosen to show how the four KPIs interact.
The day's data
| Item | Value |
|---|---|
| Doors | 6 |
| Operating hours | 12 (06:00–18:00) |
| Available door-hours | 6 × 12 = 72 |
| Appointments booked | 40 |
| Booked slot-hours | 40 × 1 h = 40 |
| No-shows (no arrival, or cancelled inside 24 h) | 3 |
| Trucks that arrived | 37 |
| Combined time at the door (docked in → done) | 51.8 h |
| Combined time on site (arrived → departed) | 70.9 h |
| Trucks on site more than 2 h | 6 |
| Combined time beyond 2 h for those 6 trucks | 4.5 h |
| Arrivals within ±30 min of slot | 29 |
| Arrivals more than 30 min early | 5 |
| Arrivals more than 30 min late | 3 |
The four KPIs
| KPI | Calculation | Result |
|---|---|---|
| Dock utilization rate (actual) | 51.8 ÷ 72 × 100 | 72% |
| Dock utilization rate (booked) | 40 ÷ 72 × 100 | 56% |
| Average dwell time | 70.9 h ÷ 37 trucks | 1 h 55 min |
| Trucks into detention | 6 ÷ 37 × 100 | 16% |
| Detention hours exposed | 4.5 h × your rate (at $75/h) | $338 for the day |
| On-time arrival rate | 29 ÷ 37 × 100 | 78% |
| Early / late | 5 ÷ 37, 3 ÷ 37 | 14% early, 8% late |
| No-show rate | 3 ÷ 40 × 100 | 7.5% |
Reading the results together is what makes them useful. Booked utilization was only 56%, yet actual utilization was 72%: trucks took longer at the door than their 60-minute slots, which is why six of them tipped into detention even on a day that was not full. Five early arrivals explain a large share of the wait time: they were on site before their door was free and their free-time clock was running. At $75 per hour, the day's detention exposure is about $338; across 250 working days that is roughly $84,000 if nothing changes. The fix is not more doors. It is 90-minute slots for the load types that need them, an enforced 30-minute early-arrival rule, and a conversation with whichever carrier sent three of the five early trucks.
Plug your own figures into the dock scheduling ROI calculator to see the annual number for your site.
How do you collect the data without a clipboard?
Every KPI above comes from four timestamps per truck, and the only sustainable way to capture them is to make them a by-product of work your team already does.
In practice that means each loading moves through statuses (booked → arrived → in progress → done) and the system records the time of each status change automatically, along with who made it. The gatehouse or receiving clerk taps "arrived" when the truck checks in and "done" when it leaves; the dock team taps "in progress" when work starts. Nobody writes anything down, and the audit log is the dataset.
LoadingCalendar records these status timestamps on every loading and shows dock workload, on-time arrivals and average waiting time in the statistics view. If you want the raw data in your own BI tool, the REST API returns loadings with their timestamps, filterable by date range, warehouse and dock. The whole thing is $99 a month flat, with a 14-day trial and no card required, which is a lot cheaper than the detention line in the example above. For how that compares with other tools, see how much dock scheduling software costs.
If you are still on a whiteboard or spreadsheet, you can run these KPIs manually for a week to get a baseline. It is tedious, but it will tell you whether the problem is big enough to be worth fixing. Five signs your warehouse has outgrown whiteboard scheduling covers what that tipping point looks like, and our guide to the best dock scheduling software compares the options once you are ready to switch.
Should you also track dock-to-stock time?
Yes, if your WMS can give it to you, because it is the one receiving metric with a real published benchmark.
Dock-to-stock cycle time is the time from goods arriving at the dock to being put away and recorded in inventory. It starts where dock scheduling ends. The Warehousing Education and Research Council's 2026 DC Measures report puts best-in-class performance (the top 20% of respondents) at under 3.1 hours.[4] It is not a dock scheduling KPI, because most of it happens after the truck has left, but a long dock-to-stock time is a common reason why doors are not ready for the next truck, which drags down utilization and pushes up wait time. If you track the four KPIs above and dock-to-stock together, you have the whole inbound picture.
Frequently asked questions
Sources
- American Transportation Research Institute (ATRI), "Costs and Consequences of Truck Driver Detention: A Comprehensive Analysis" (September 2024): detention at 39.3% of stops in 2023; $3.6 billion in direct expenses and $11.5 billion in lost productivity; more than 135 million hours lost; detained trucks driving 14.6% faster than non-detained trucks. truckingresearch.org
- U.S. Department of Transportation, Office of Inspector General, "Estimates Show Commercial Driver Detention Increases Crash Risks and Costs, but Current Data Limit Further Analysis", report ST2018019 (31 January 2018): a 15-minute increase in average dwell time raises the expected crash rate by 6.2%. oig.dot.gov
- Dunn, Hickman, Soccolich and Hanowski (Virginia Tech Transportation Institute for the Federal Motor Carrier Safety Administration), "Driver Detention Times in Commercial Motor Vehicle Operations" (December 2014): detention on about 1 in 10 stops, averaging 1.4 hours beyond the 2-hour standard. vtechworks.lib.vt.edu
- Warehousing Education and Research Council (WERC), "2026 DC Measures Report": headline metrics; best-in-class (top 20% of respondents) dock-to-stock cycle time under 3.1 hours, as summarised by report sponsor Yale Lift Truck Technologies. yale.com
- McKinsey & Company with the Trading Partner Alliance, "Defining 'on-time, in-full' in the consumer sector" (June 2019): survey of 24 North American retailers and CPG manufacturers, no consensus on the on-time window; McKinsey's figure of about 25% of deliveries arriving more than two hours before their appointment. mckinsey.com
The six-door warehouse example and the $75/hour detention rate are illustrative arithmetic, not measured data. Detention rates vary by carrier, country and load type.
You might also like

OTIF (On Time In Full) is the share of orders delivered complete and within the agreed window. Formula, worked example, benchmarks and how to measure it.
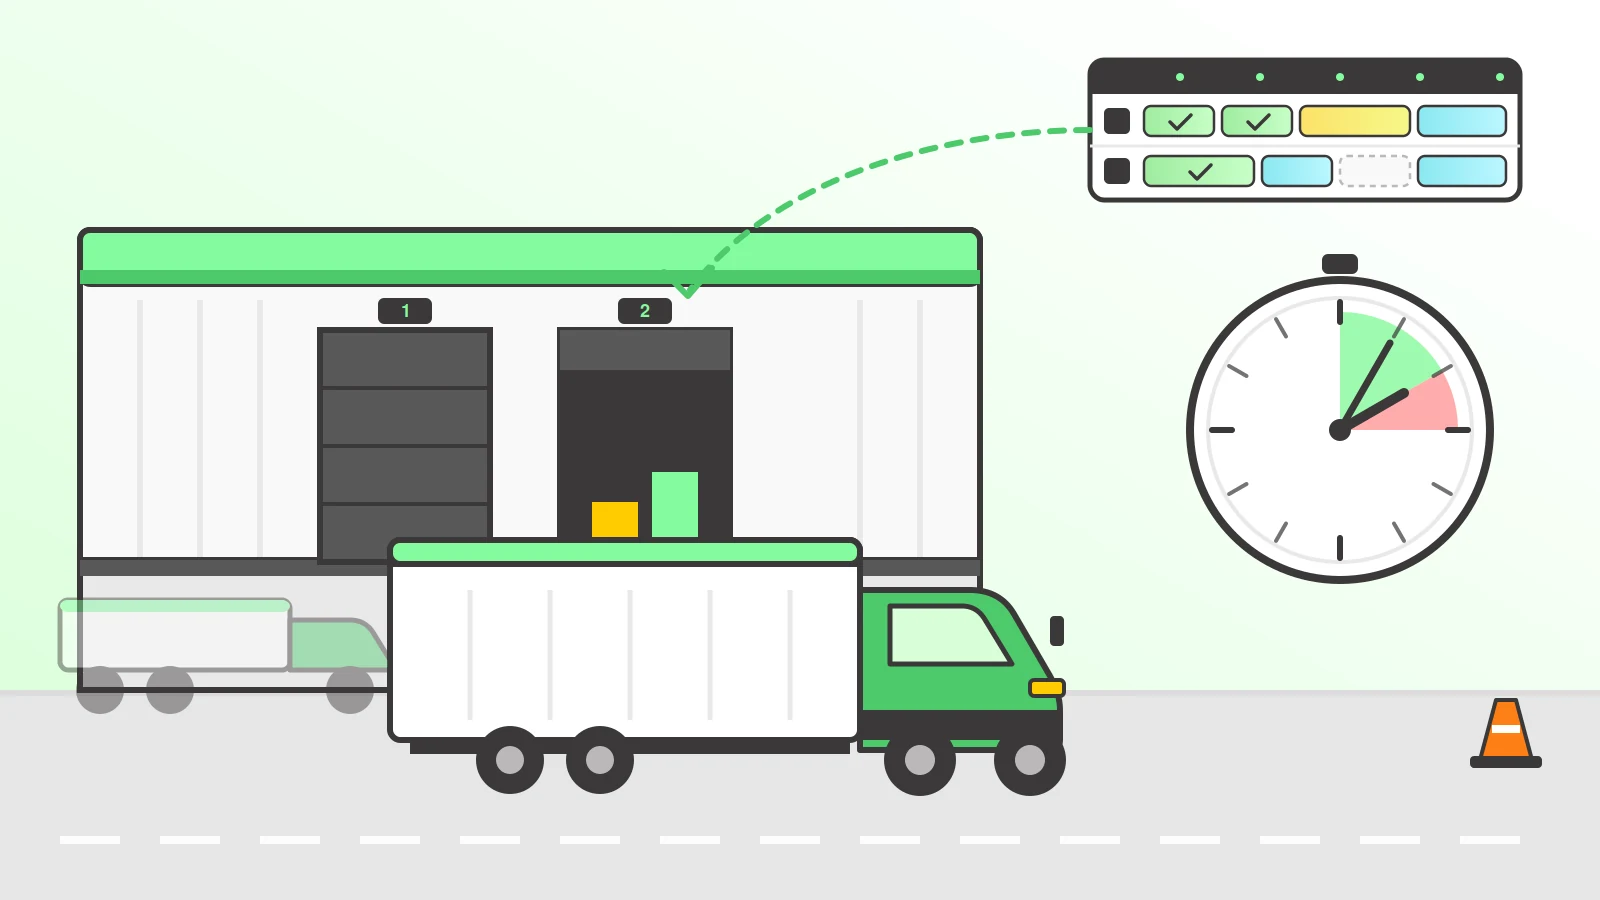
How to reduce detention fees: put every truck on an appointment, match slot lengths to real loading times, and log arrival, dock-in and departure automatically.
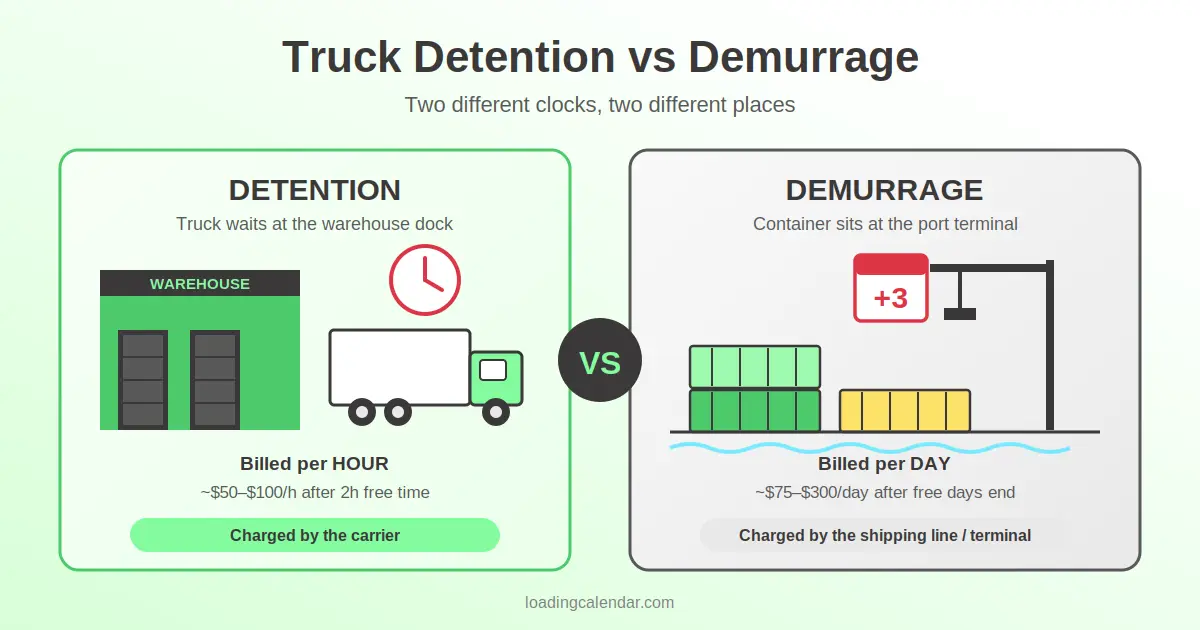
Truck detention is the fee carriers charge when drivers wait past free time — typically $50–$100/hour after 2 hours. Demurrage is a daily port charge. Here's the difference, who pays, and how to avoid both.
Ready for simpler warehouse scheduling?
Join warehouse teams across the world that replaced spreadsheets and phone calls with simple dock appointment scheduling software.
Start My Free Trial 14-day free trial · No credit card required · Cancel anytime